My
Publications
MLN-Visualizer: Interactive Visualization of Graphs and Multilayer Network Analysis Results
IEEE BigDataServices 2023
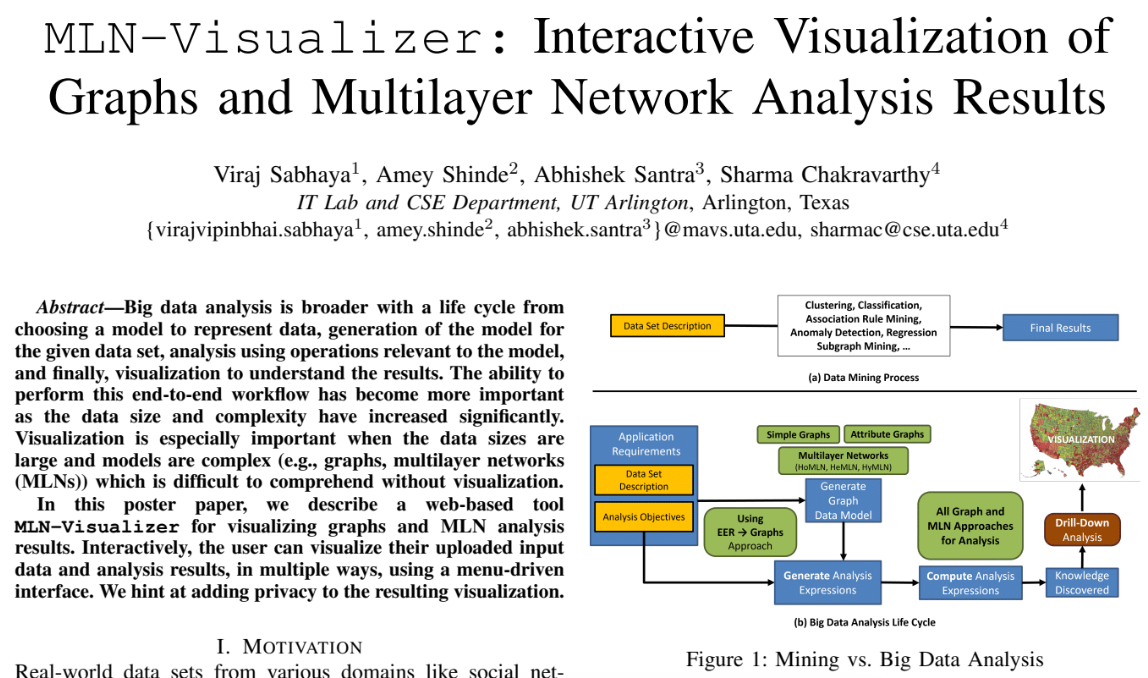
Abstract—Big data analysis is broader with a life cycle from choosing a model to represent data, generation of the model for the given data set, analysis using operations relevant to the model, and finally, visualization to understand the results. The ability to perform this end-to-end workflow has become more important as the data size and complexity have increased significantly. Visualization is especially important when the data sizes are large and models are complex (e.g., graphs, multilayer networks (MLNs)) which is difficult to comprehend without visualization. In this poster paper, we describe a web-based tool MLN-Visualizer for visualizing graphs and MLN analysis results. Interactively, the user can visualize their uploaded input data and analysis results, in multiple ways, using a menu-driven interface. We hint at adding privacy to the resulting visualization.

A series of blogs written for people with no CS background to get an overview of some interesting concepts in the world of Computer Science.